

As of August 14th, the United States and Europe have an inverted yield curve on Government debt, when comparing 2-year debt to 10-year debt. The last two times this yield curve has inverted were in 2000 and 2006, continuing into 2007.
Yield is the amount of interest received on a debt instrument purchased by an investor.
What this means is that investors are willing to invest in longer term debt when it is paying an interest rate lower than shorter term debt.
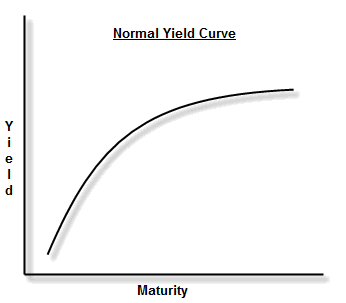
With a normal yield curve, interest rates (yield) are lower on short-term obligations and increase as the debt term is extended. A normal yield curve can be graphed as follows:
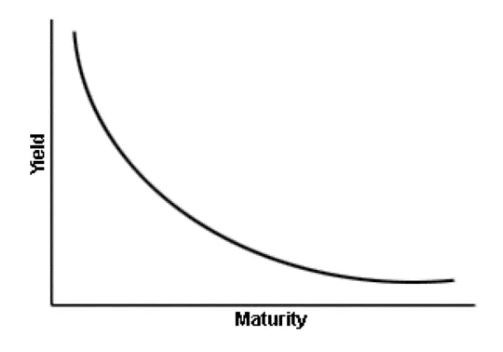
With an inverted yield curve, the graph would be:
Why is there an inverted yield curve?
The yield curve becomes inverted when there is more demand for long-term bonds than usual. It comes back to supply and demand. When there is more demand for long-term debt, the yield declines. This is because the issuers or holders of the debt can demand a higher price for the debt. A simple example to illustrate:
In normal demand, Kelley bought a 10-year bond for $10,000. It was yielding 3%, or $300 per year. Now, several investors are interested in buying Kelley’s bond. She puts it up for auction, and Greg makes the highest offer of $10,500. Greg will still receive $300 per year, but now it is only 2.86% to Greg.
Does this mean a recession is coming?
An inverted yield curve preceded the last seven U.S. recessions, with one occasion in the 1960’s where the inversion happened but was not followed by a recession. The inverted yield curve has been a regular predictor of a recession. However, the timing of the following recession can be several months or up to two years after the inversion.
The inverting of the yield curve itself has no overall impact on the economy. But the reason the yield curve is inverting creates the concern.
Historically the yield curve inverts when investors are concerned about a stock market decline, and therefore are looking at bonds as a safer option. When they look at the bond market, they are concerned that interest rates are going to decrease, so they do not want to buy short-term debt, because they feel the interest rate will be lower when they need to reinvest the proceeds from the short-term debt. Therefore, they buy longer term debt, which pushes the interest rate down.
There is an argument that this inversion is not an indicator of a recession, but is instead a market reaction to the Federal Reserve potentially continuing to reduce rates, which is causing bond investors to seek a longer-term interest lock-in.
Regardless of the reason, this is certainly an indicator that deserves close attention based on past market results after inverting yield curves. There isn’t a one size fits all recommendation, but if you would like to discuss your investment plan, please give us a call. Again, this is just one measure of the market, and your own risk tolerance and view of the economy could lead you to a different plan than someone else.